


 (1)_LBMA.jpg)


Your shopping cart
No products in the shopping cart
 801 501 521
- Author of the entry: Mennica Skarbowa
- Date of entry:
Gold has recently demonstrated how the market discounts future events and what is meant by the statement "itis already priced in." Precious metal prices remained extremely stable. We can see that, once again, financial markets were driven by future events. The old rule of "buy the rumor, sell the fact" proved true.
Chart 1: Gold prices, period from April 16 to May 15.
Chart 1: Gold prices, period from April 16 to May 15.
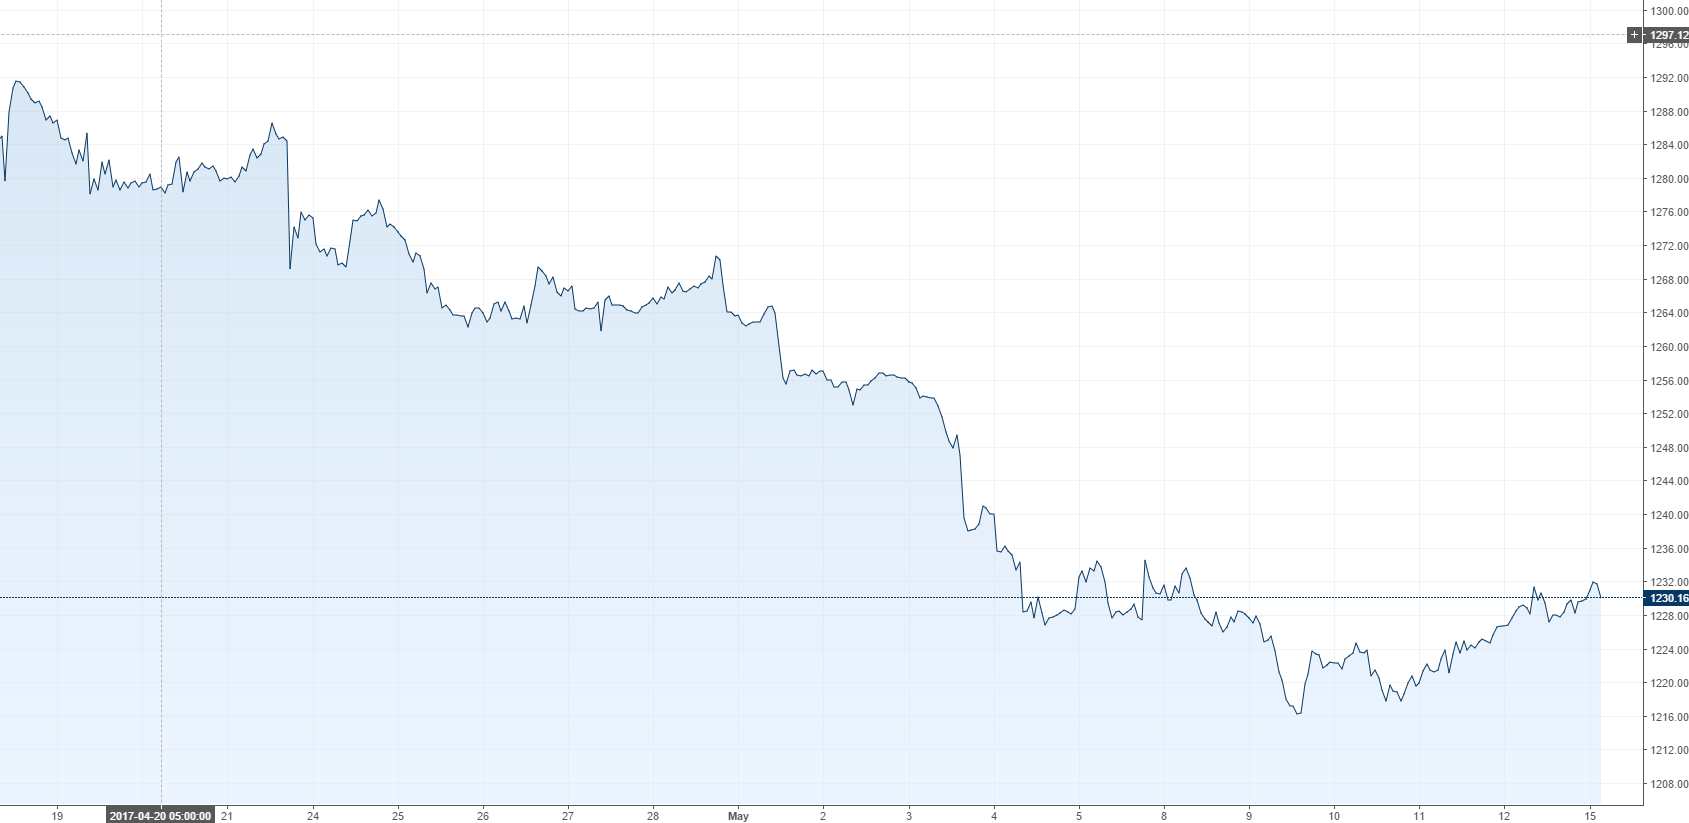
The biggest drop in gold prices occurred in the week preceding the second round of the presidential election in France. When polls showed Emmanuel Macron's growing lead, the precious metal lost value and investors disposed of it from their portfolios. The decline in the first week of May reached 3.5%. When the markets learned the official results and it became clear that the centrist candidate would lead France, gold continued to lose value for two more days (Monday and Tuesday). Since Wednesday, prices have been heading north again. Of course, there is still a long way to go to make up for the losses, but the technical formation on the chart may give cause for optimism. Perhaps a local bottom has formed on the chart.
Last week, we heard several statements from Fed members, which clearly indicate that we will see three more interest rate hikes this year. Only Eric Rosengren turned out to be more "hawkish," expressing concerns about the US economy overheating. On Friday, gold prices were helped by inflation data from the United States. The year-on-year change in the CPI was 2.2%, which was worse than expected (2.3%), and core inflation also disappointed. In addition, the published data on US retail sales was worse than the consensus (0.4%, 0.6% expected). As a result of these publications, the EUR/USD pair jumped to 1.0932, and gold ended the week at around $1,227 per ounce.
Political tension increased after Donald Trump dismissed the head of the FBI. The news spread around the world on Tuesday evening (Polish time). James Comey's dismissal caused gold prices to rebound. Since then, the price has been steadily rising.
Technical analysis
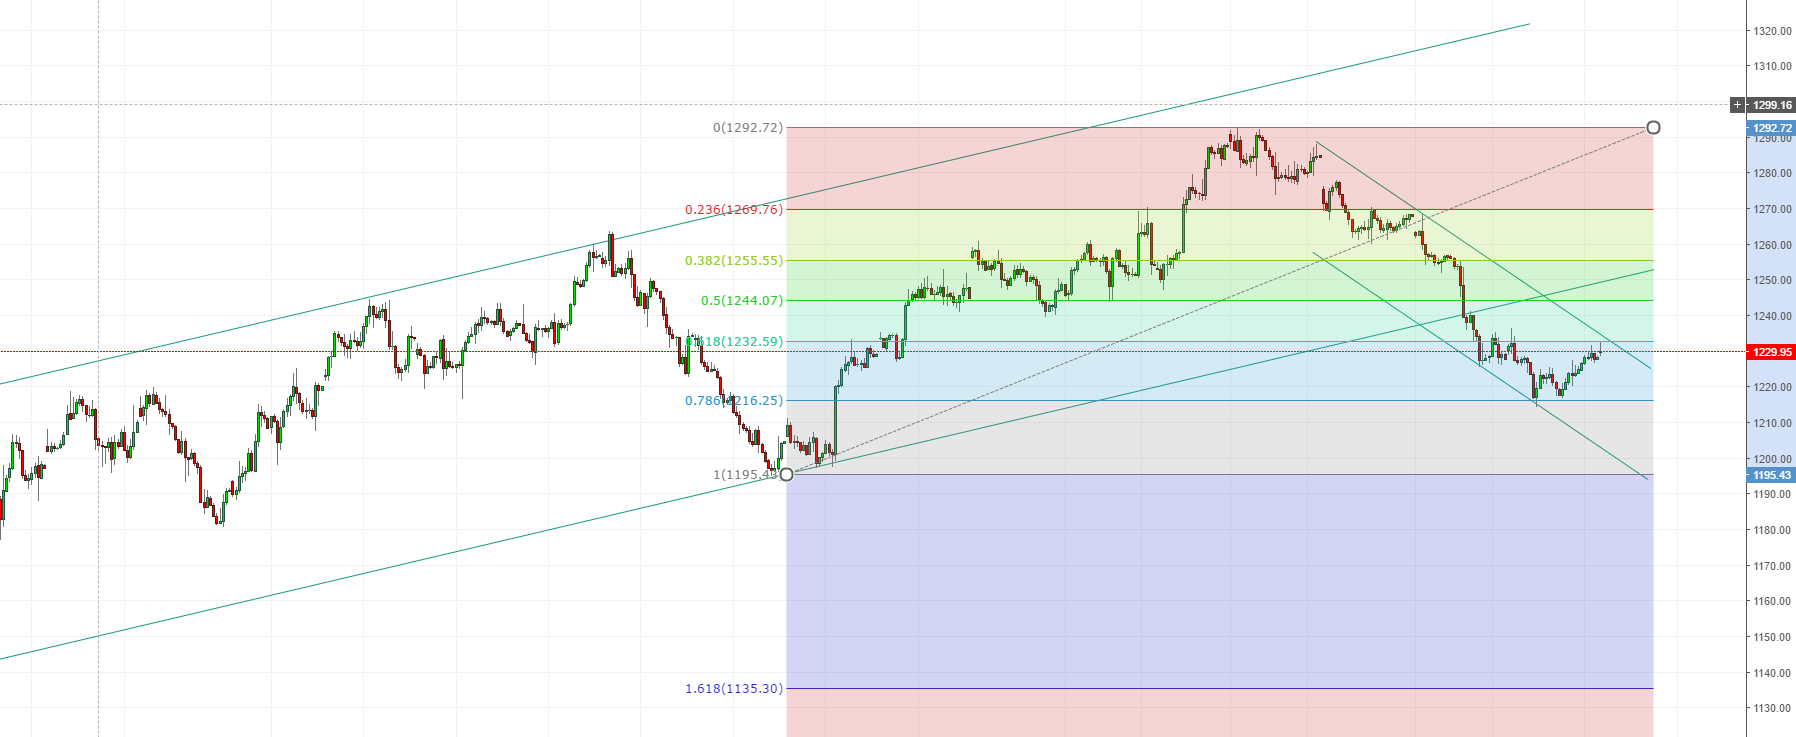
Despite a slight rebound in prices, gold is still in a short-term downward channel. The sharp declines in May slowed down around the internal retracement according to Fibonacci's theory (78.6%). In addition, a double bottom formation is forming on the chart, which may push the price of gold to around $1,250 per ounce in the near future (short-term forecast). A negative technical signal was recently (in the first week of May) the break below the long-term upward channel, which may result in a longer-term sell-off of the metal.
Chart 2: Technical analysis of gold, 4-hour chart.
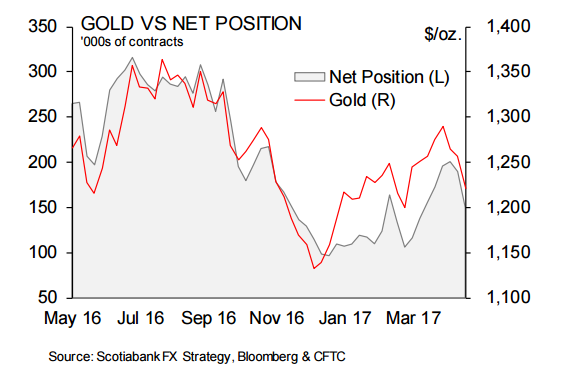
Looking at CFTF reports on the net speculative position of investors on the Chicago Stock Exchange, we can see that it has recently decreased and approached the level of 150,000 contracts. Given that these data reflect the situation as of May 9, this should be explained by the reduction of long positions even before the results of the French elections. We are still seeing an upward trend here, which would be negated if the number of contracts fell below 100,000.
Chart 3: Net speculative position on gold contracts according to CFTC data and gold chart.
Arkadiusz Kłosiński
Mennica Skarbowa S.A.
Mennica Skarbowa S.A.
